SQL for Application Developers
Learn SQL from scratch with a focus on what app devs need to know, from schema design to writing transactions that perform at scale.
Start LearningIndexes are a crucial part of your database schema. They improve workload performance by helping the database locate data without having to scan every row of a table. Although it might be tempting to create an index for every column that your workload uses to filter data, it’s important to consider the performance tradeoffs of indexes. While indexes greatly improve the performance of read queries that use filters, they do come with a cost to write performance: data has to be written for all indexes present on the table.
CockroachDB has a group of features that can help you analyze the usage of your indexes, and provide recommendations for whether you should create new indexes, or drop or update existing ones. In this blog post we will show you how to use these features.
Use the Statements Page to avoid full scans
A query causes a full table scan when there is no way for the database to avoid reading all of the data for a table to satisfy the query. A full table scan causes the database to read every single byte on disk for a table, which is very expensive for large tables. For example, a query like SELECT * FROM t WHERE id = 10 will cause a full table scan if there’s no index on the “id” column of the table.
Full scans are often optimization opportunities and signals for a better indexing strategy. Queries that filter for a subset of rows but are forced to scan the full table would benefit from a secondary index to allow better pruning of scanned rows, reducing IO, and increasing overall performance. An easy way to identify which statements are being executed with full table scans is clicking on the Statements tab, under the SQL Activity page and selecting the filter “Only show statements with full table scans”.
Since CockroachDB aggregates the values on the Statement Overview page on the selected period, you might be seeing a statement fingerprint (which is a representation of the SQL statement made by replacing literal values, such as numbers and strings, with underscores) on the table whose latest execution might not have used a full scan, so the next step is to go to its Details page, by clicking the Statement in question.
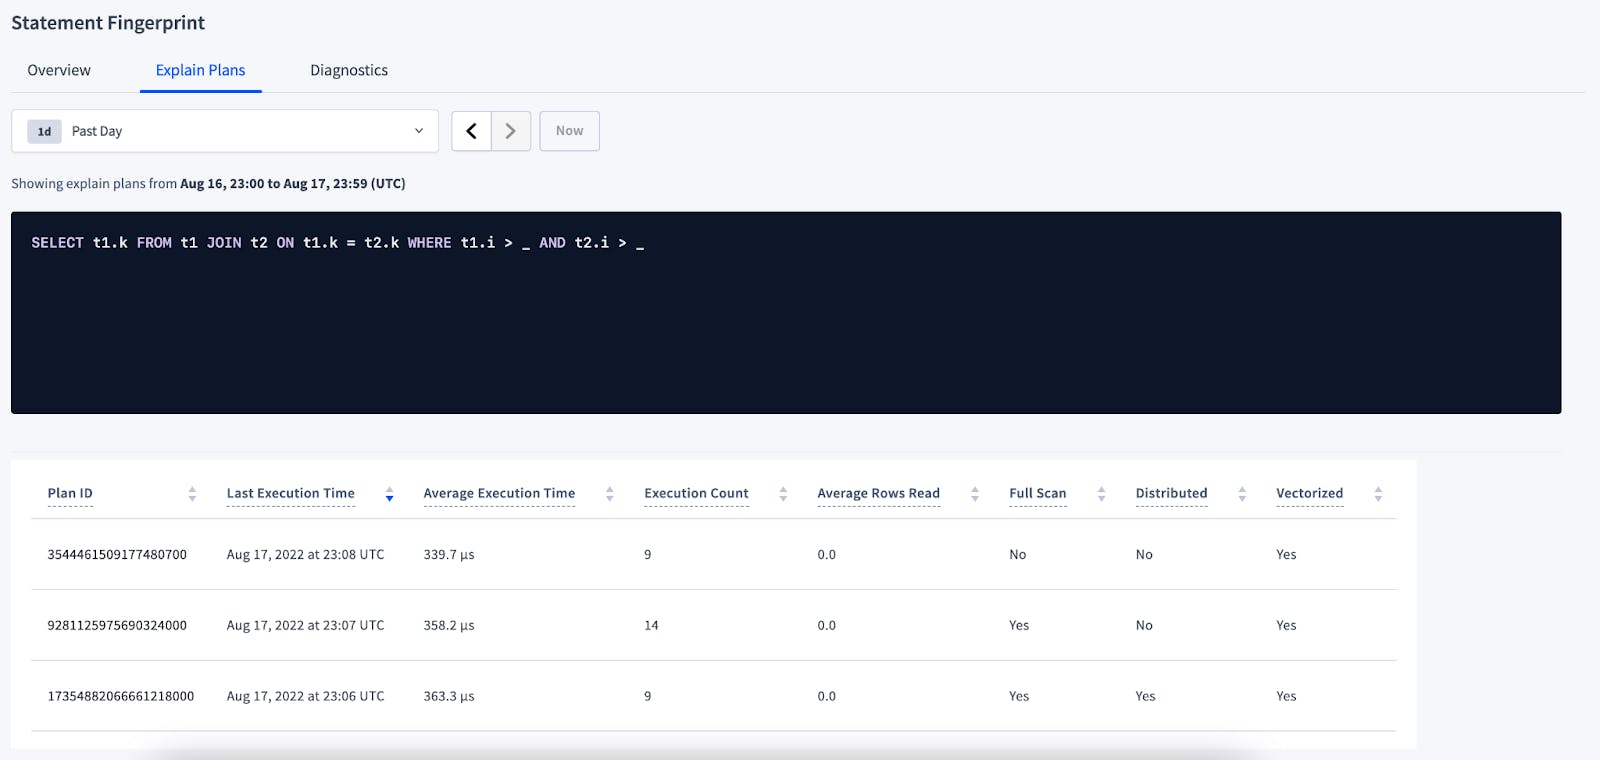
From there select the Explain Plans tab. There you will be able to see all plans used by that statement fingerprint ID during the selected period. One of the columns on the plans table is Last Execution Time and another is Full Scan, which will allow you to identify if the latest plan execution was with a full scan.

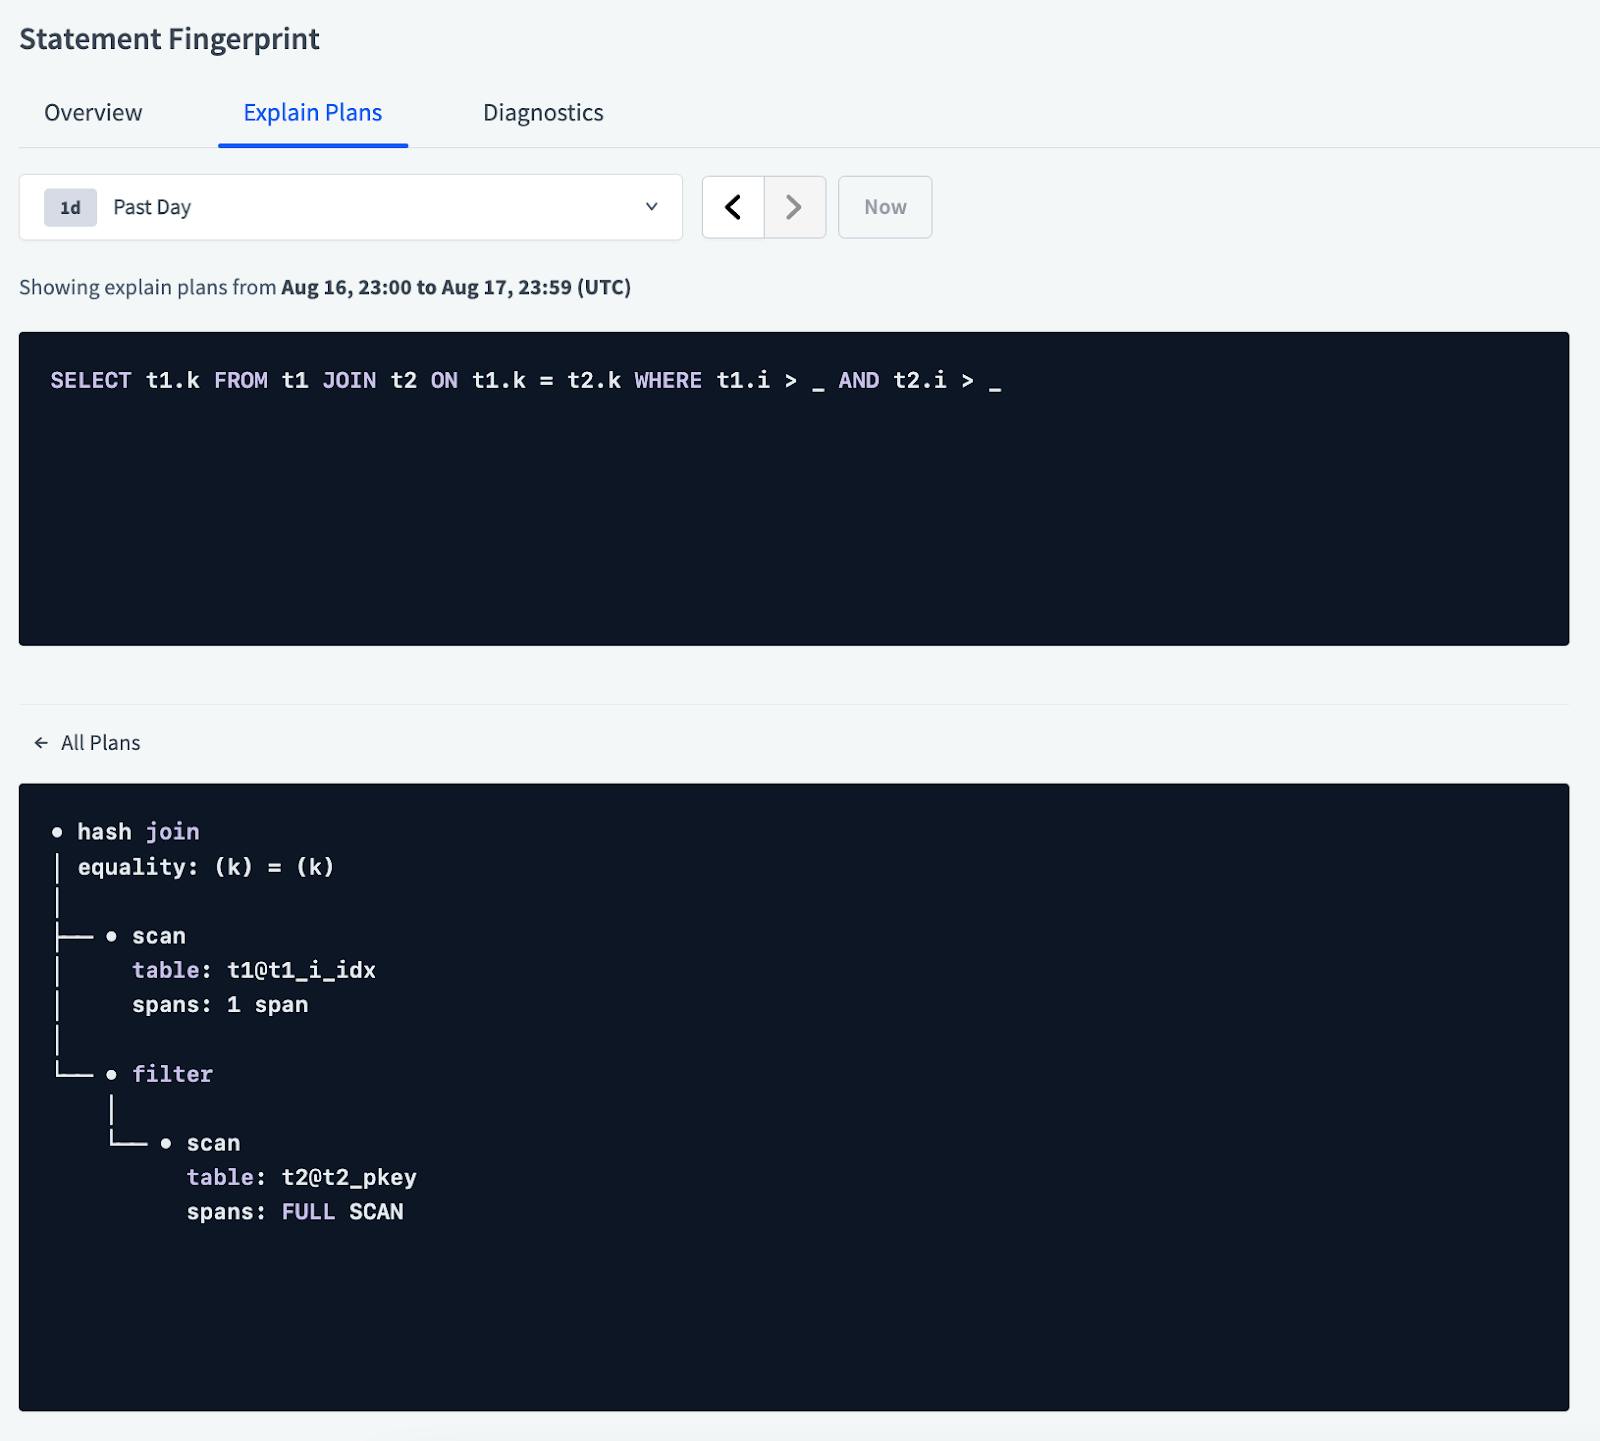
You can also click on each plan to see its full query plan.

Besides the statements with full scans, you can also look into statements that have a higher execution time.
Now that you have a few statements that you might want to create or improve the existing indexes, let’s find recommendations for them.
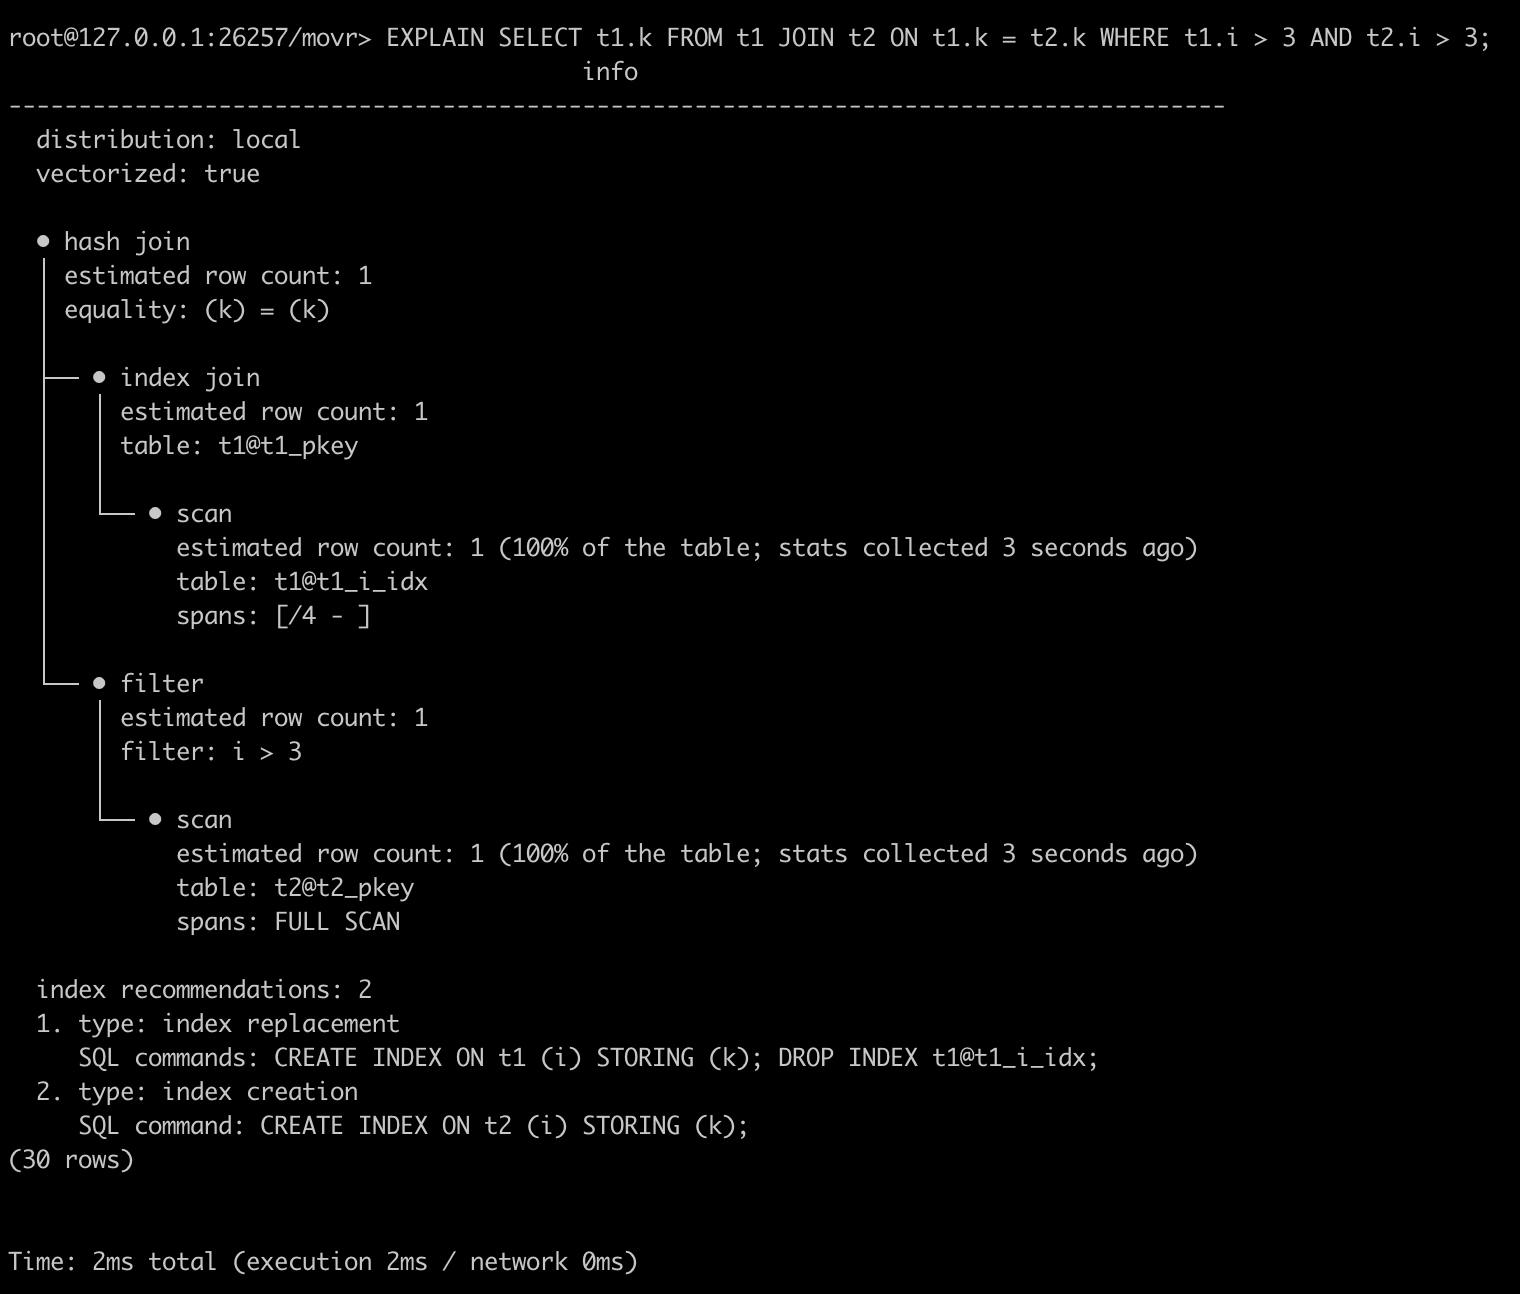
To find index recommendations, you can use the powerful EXPLAIN command, which returns information about the statement plan that the optimizer has selected for a query. You can also use EXPLAIN ANALYZE which will actually execute the SQL query and generate a statement plan that’s annotated with execution statistics.

Notice the information at the bottom of the EXPLAIN output: recommendations for creating and also replacing indexes. These recommendations are the database’s best guess at how you could improve an individual statement with different indexes.
A common mistake you can make is to create a secondary index without a STORING clause, which can result in an index join. Index joins can be slow since they require performing a lookup in the primary index for every row scanned in the secondary index. In this case, you might get the recommendation to replace the index with one containing the STORING clause.
After you create or modify indexes, you can go back to the same details page for the selected statement and check the statistics again, where you will be able to observe updated performance information now that the new indexes are in place.
If the amount of data in a table changes significantly, new columns are introduced to the table, or new access patterns are added, it’s good practice to monitor workload performance with the features mentioned above, so you can make sure the workload is always performing optimally.
Use Index Statistics to find indexes with low or no usage
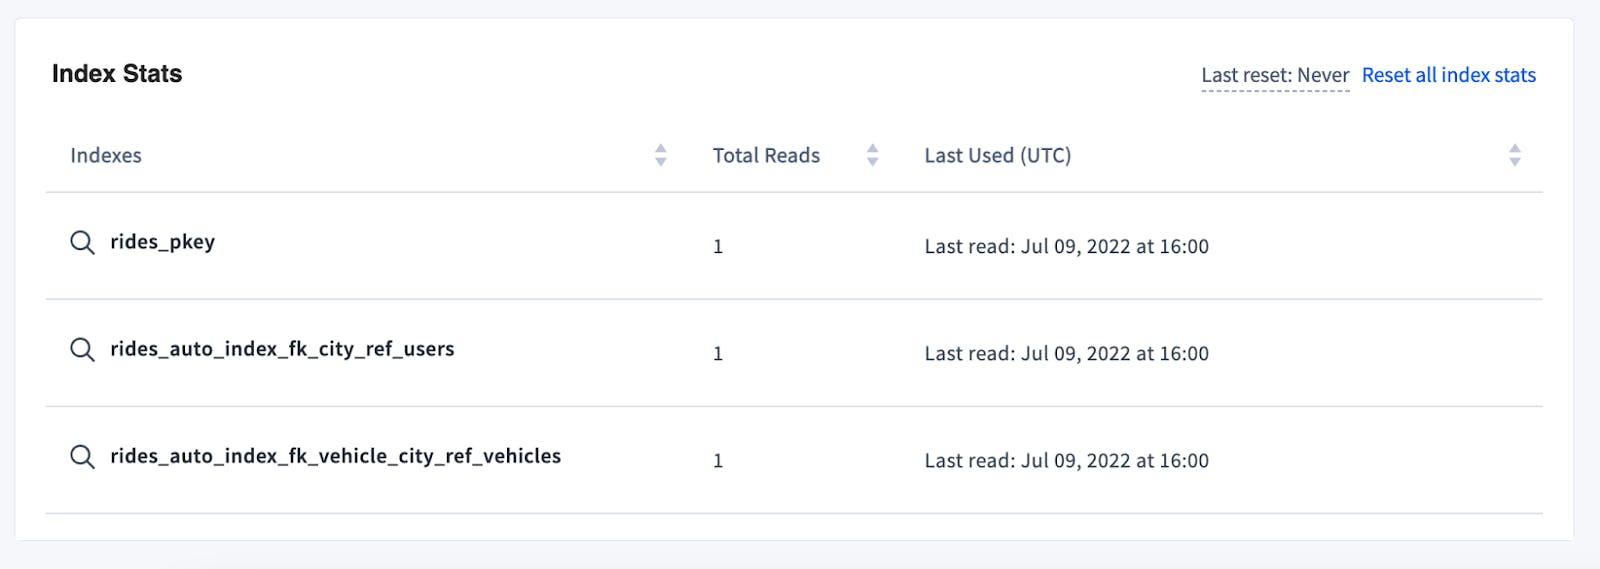
On the Database page, click on any database to see the list of tables it contains. That view will also display the number of indexes on each particular table. Clicking on the table name will bring you to the Table Details page, where you can see the list of all indexes and the stats for each one, including the name, total reads and last time it was used.
On the index stats table you can see if there are indexes with a low count of total reads, never used or only used a long time ago. Those indexes could be degrading your write performance, without significant positive impact on read performance, so they’re good candidates to consider dropping.

If you made a recent change to indexes, you can click on Reset all index stats, which will clear all the data from the cluster, allowing you to focus your analysis on the latest metrics only.
You can also reset index stats with CLI with SELECT crdb_internal.reset_index_usage_stats().
Stay tuned for some updates coming this fall in v22.2 that will make it even easier to see index recommendations!
If there is a new feature that you want or you’re having a performance issue that you need our assistance, use one of our support resources to reach out to us, we’re happy to help!
To learn more about this topic, here are a few other resources:


