As a developer, you are often faced with the question: why is my application slow? You may have already identified the database as the bottleneck (even this process can take some troubleshooting), and you then find yourself asking:
- Which queries are slow?
- Which queries should I be troubleshooting?
The query troubleshooting journey starts by first isolating the offending query that is issued by your application.
Step 0: Tag (label) your application when connecting to the database
It is best practice to tag your application with a label or name when connecting to your database, enabling you to track the source of incoming queries. Most databases support this capability, and you can use this to your advantage to quickly filter and isolate the application-specific workloads containing problematic queries.
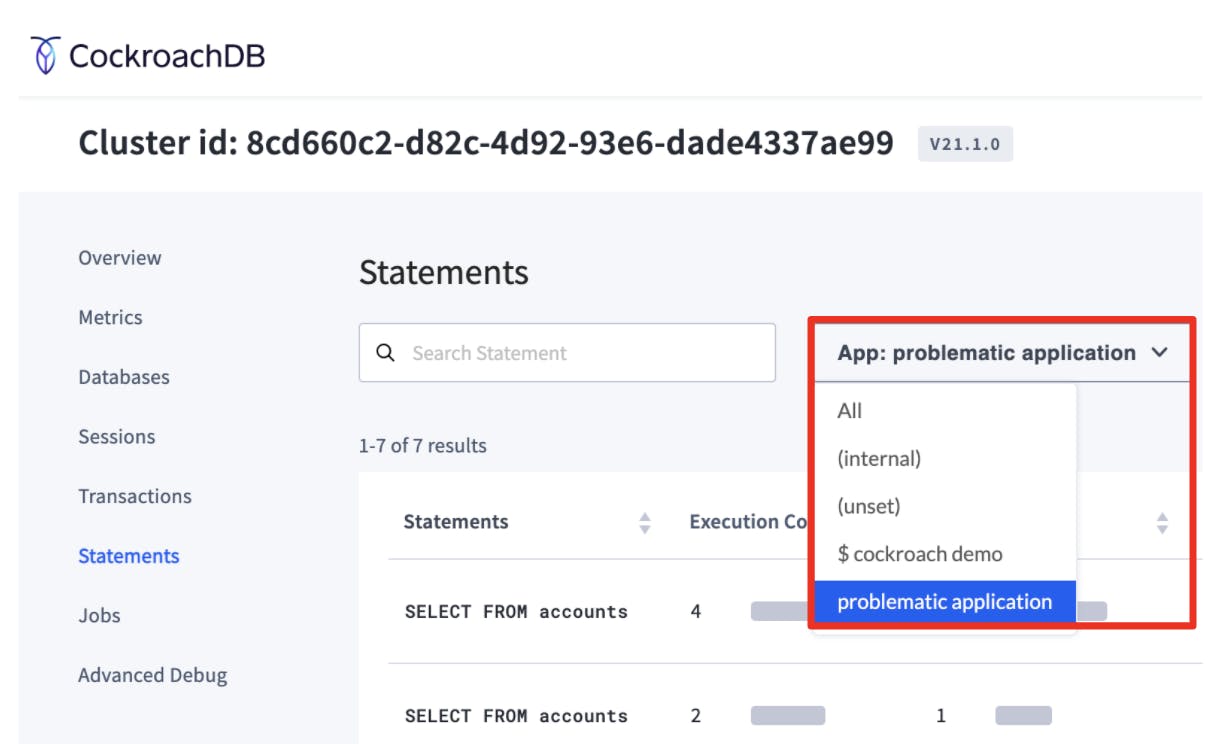
In CockroachDB, you can follow these instructions to set the application name when connecting to your database. You can then use the DB console to filter by this application name and retrieve the set of queries that may be experiencing performance issues and impacting your application. Starting with CockroachDB 21.1, you can also filter by statement type to pinpoint specific operations within your application.

Step 1: How to identify the slow query from your application
The next step is to identify the specific slow queries issued from your application. Databases typically offer system views into running and previously ran queries, including runtime statistics, to help you find troublesome queries.
Step 1a: How to identify a slow query using the DB Console
CockroachDB provides an out-of-the-box DB Console to enable you to monitor and optimize cluster performance. You can use the console to filter and sort for specific slow queries including their runtime statistics on the Statements page.

Step 1b: How to identify a slow query with `slow query log`
For a quick cheat, CockroachDB supports a slow query log where queries passing a custom duration threshold will be automatically captured and written to a separate view.
SET CLUSTER SETTING sql.log.slow_query.latency_threshold = '100ms';
Slow Query Log:
   "Timestamp":1626455175848119000,
   "EventType":"slow_query",
   "Statement":"‹SELECT l_returnflag, l_linestatus, sum(l_quantity) AS sum_qty, sum(l_extendedprice) AS sum_base_price, sum(l_extendedprice * (1 - l_discount)) AS sum_disc_price, sum((l_extendedprice * (1 - l_discount)) * (1 + l_tax)) AS sum_charge, avg(l_quantity) AS avg_qty, avg(l_extendedprice) AS avg_price, avg(l_discount) AS avg_disc, count(*) AS count_order FROM \"\".\"\".lineitem WHERE l_shipdate <= ('1998-12-01' - '95 days') GROUP BY l_returnflag, l_linestatus ORDER BY l_returnflag, l_linestatus›",
   "Tag":"SELECT",
   "User":"root",
   "ApplicationName":"$ cockroach sql",
   "ExecMode":"exec",
   "NumRows":4,
   "Age":7681.835,
   "FullTableScan":true,
   "TxnCounter":8
Step 1c: How to identify a slow query based on plan attributes
One of the most common query plan issues is when the optimizer chooses a plan that scans more data than required, leading to longer query times. This issue can be indicated by a FULL scan in CockroachDB within the query plan.
You can disallow queries with FULL scans using a cluster setting to preemptively fail and be alerted of this issue - this is particularly helpful when getting started on your application with an initial basic database schema design. You can also filter for queries with FULL scans in the DB console in conjunction with your application name. These capabilities allow you to locate queries with suboptimal plans and begin the tuning process.
SET CLUSTER SETTING sql.defaults.disallow_full_table_scans.enabled = 'true';
SELECT * FROM region;
ERROR: query `SELECT * FROM region` contains a full table/index scan which is explicitly disallowed

Step 2: How to introspect the query plan and tune performance with `EXPLAIN`
After identifying a problematic query, use EXPLAIN. EXPLAIN is one of the most critical commands in your tooling arsenal when introspecting and tuning the query. Running EXPLAIN will return the logical query plan that the optimizer has selected. In this example, we’ve run EXPLAIN on a troublesome query identified in CockroachDB:
                                                  info

--------------------------------------------------------------------------------------------------------

  distribution: full

  vectorized: true


  • sort

  │ estimated row count: 6

  │ order: +l_returnflag,+l_linestatus

  │

  └── • group

      │ estimated row count: 6

      │ group by: l_returnflag, l_linestatus

      │

      └── • render

          │ estimated row count: 5,917,362

          │

          └── • filter

              │ estimated row count: 5,917,362

              │ filter: l_shipdate <= '1998-08-28'

              │

              └── • scan

                    estimated row count: 6,002,293 (100% of the table; stats collected 39 minutes ago)

                    table: lineitem@primary

                    spans: FULL SCAN

(22 rows)


Time: 2ms total (execution 2ms / network 0ms)
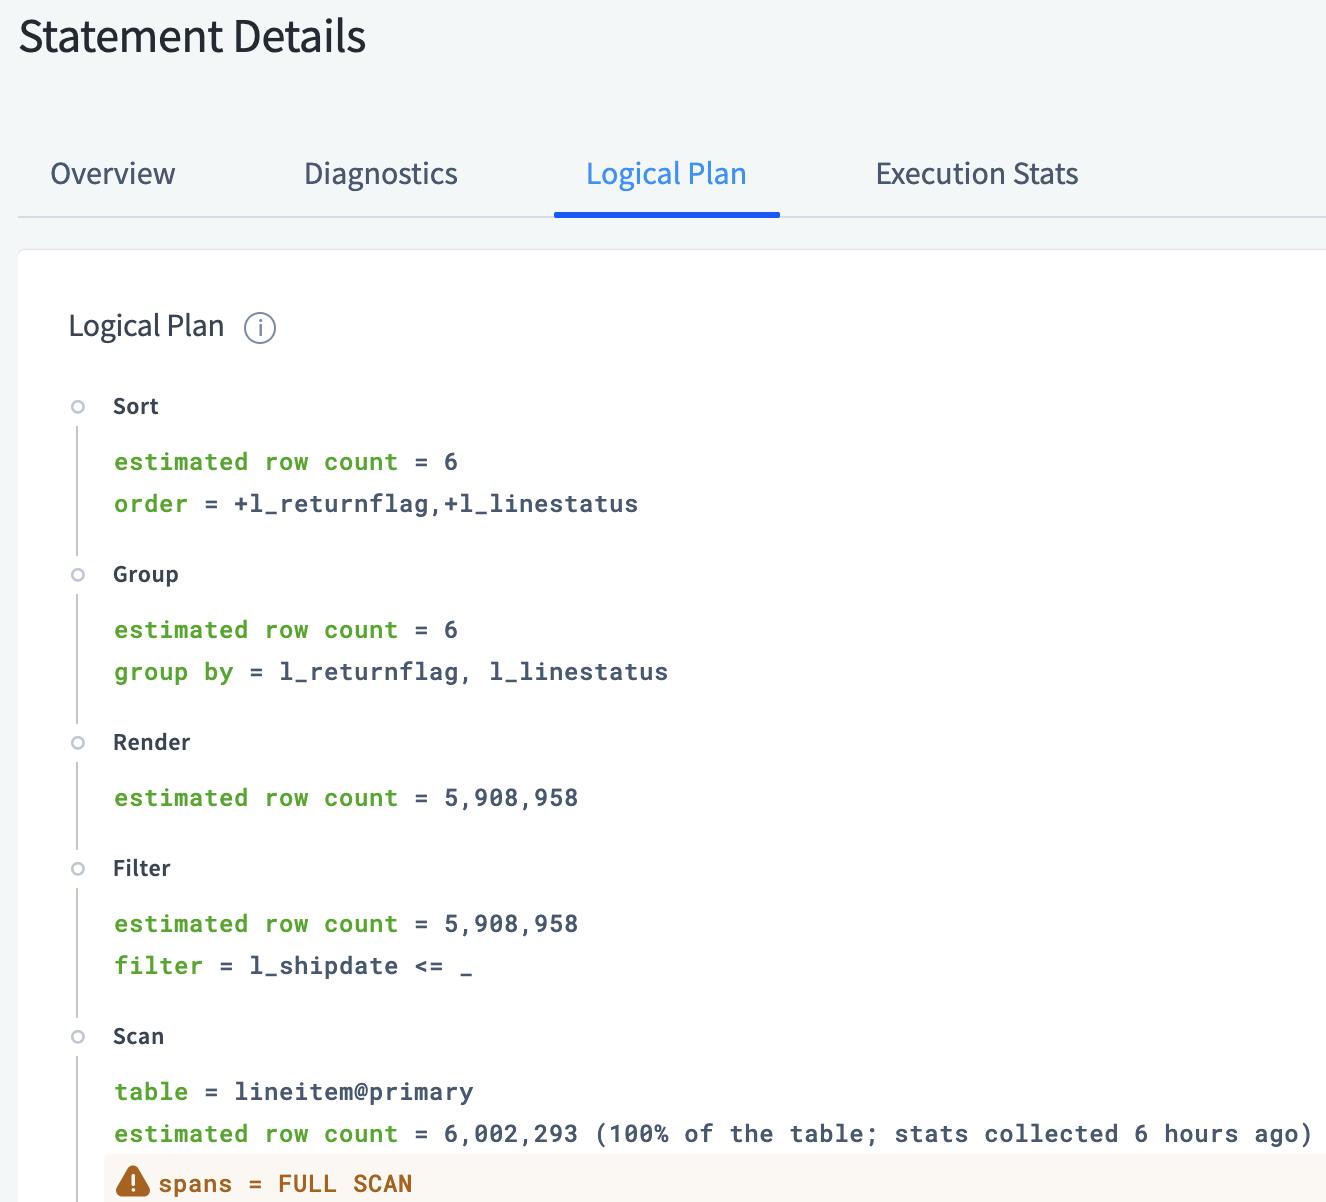
In the logical query plan above, notice where it says spans: FULL SCAN. As previously mentioned, a FULL SCAN in the query plan is suboptimal especially when scanning a relatively large number of rows. This plan tree is a typical indicator that the query would benefit from a secondary index. Secondary indexes copies and sorts rows based on the indexed columns which allow you to efficiently access rows in the database. Secondary indexes should be carefully created as you pay an additional write penalty to maintain the index for better read performance. You can learn more about secondary indexes specifically for CockroachDB in our documentation.
If you’re using CockroachDB, the DB console also surfaces query plans graphically to help you quickly detect FULL scans:

Step 3: How to find performance bottlenecks with `EXPLAIN ANALYZE`
To further understand how your query will be executed, most databases support running EXPLAIN with query execution. This enables you to execute the query and capture the actual physical plan including runtime statistics. You can then use runtime statistics to understand where the bottleneck can be which is especially helpful for distributed SQL databases.
This is done in CockroachDB using EXPLAIN ANALYZE, and in 21.1, CockroachDB released several enhancements to EXPLAIN ANALYZE. You can now see the physical plan directly in the SQL CLI to understand how query execution is distributed across your cluster with runtime statistics such as contention, duration across each node, etc.
info
--------------------------------------------------------------------------------------------
planning time: 353µs
execution time: 3ms
distribution: local
vectorized: true
rows read from KV: 52 (5.8 KiB)
cumulative time spent in KV: 2ms
maximum memory usage: 60 KiB
network usage: 0 B (0 messages)
cluster regions: us-east1
• update
│ cluster nodes: n1
│ cluster regions: us-east1
│ actual row count: 1
│ table: users
│ set: name
│ auto commit
│
└── • render
│ cluster nodes: n1
│ cluster regions: us-east1
│ actual row count: 1
│ estimated row count: 0
│
└── • filter
│ cluster nodes: n1
│ cluster regions: us-east1
│ actual row count: 1
│ estimated row count: 0
│ filter: id = '32a962b7-8440-4b31-97cd-a7d7757d6eac'
│
└── • scan
cluster nodes: n1
cluster regions: us-east1
actual row count: 52
KV time: 2ms
KV contention time: 0µs
KV rows read: 52
KV bytes read: 5.8 KiB
estimated row count: 50 (100% of the table; stats collected 3 minutes ago)
table: users@primary
spans: FULL SCAN
(42 rows)
Time: 4ms total (execution 4ms / network 0ms)
In the physical query plan above, you can see that statistics are up to date. Information such as contention time is surfaced to help you troubleshoot slow performance due to transaction contention. We also see a FULL SCAN during the execution returning 52 records which can potentially be reduced with a secondary index.
Inspecting query plans surfaced through `EXPLAIN` can surface many other insights into designing and updating your schema. CockroachDB provides a comprehensive guide to using `EXPLAIN` when designing your database schema.
For general information on query performance with CockroachDB, sign up for our Cockroach University Course on Query Performance for Developers. If you have questions or feedback, we encourage you to join the #cockroach-university channel in our CockroachDB Community Slack.


