CockroachDB makes it possible to support a global customer base while remaining compliant with data privacy regulations. Operators interact with a single logical control plane that they can use to define how they want CockroachDB to store their row-level data. Meanwhile, developers continue to interact with our PostgreSQL-compatible API that transparently handles distributing queries across a global cluster. With our 2.0 release, we introduced a new cluster visualization in our web UI to help operators monitor a global cluster.
In this blog, we’ll use a fictional startup - MovR - to outline how CockroachDB 2.0 makes it easier for operators to manage infrastructure for global user bases. "MovR" (first introduced in our 2.0 meetup) is a P2P vehicle sharing app looking to take over the global market for vehicle sharing. The majority of their customers are in New York, where they started, and they have recently expanded to San Francisco and Amsterdam.
MovR’s users want to book the vehicles they need whenever they need them without having to stare at a loading circle. Running a single datacenter in New York is not an option, as this setup would be prone to service outages and forces users in San Francisco and Amsterdam to experience the network latency that comes with having to access data that lives in New York.
Low Operational Cost
MovR doesn’t have the resources to invest in huge operations teams to build and maintain complex infrastructure. They want to focus on doing what they do best - building features for P2P vehicle sharing. With CockroachDB, operators define how they want CockroachDB to store data, and the database handles the placement, replication, and consistency of the data transparently to the user. Operators only have to monitor a single cluster compared to multiple disparate stacks installed in different countries.
Visualizing Global Deployments
Single logical control plane for operators and developers
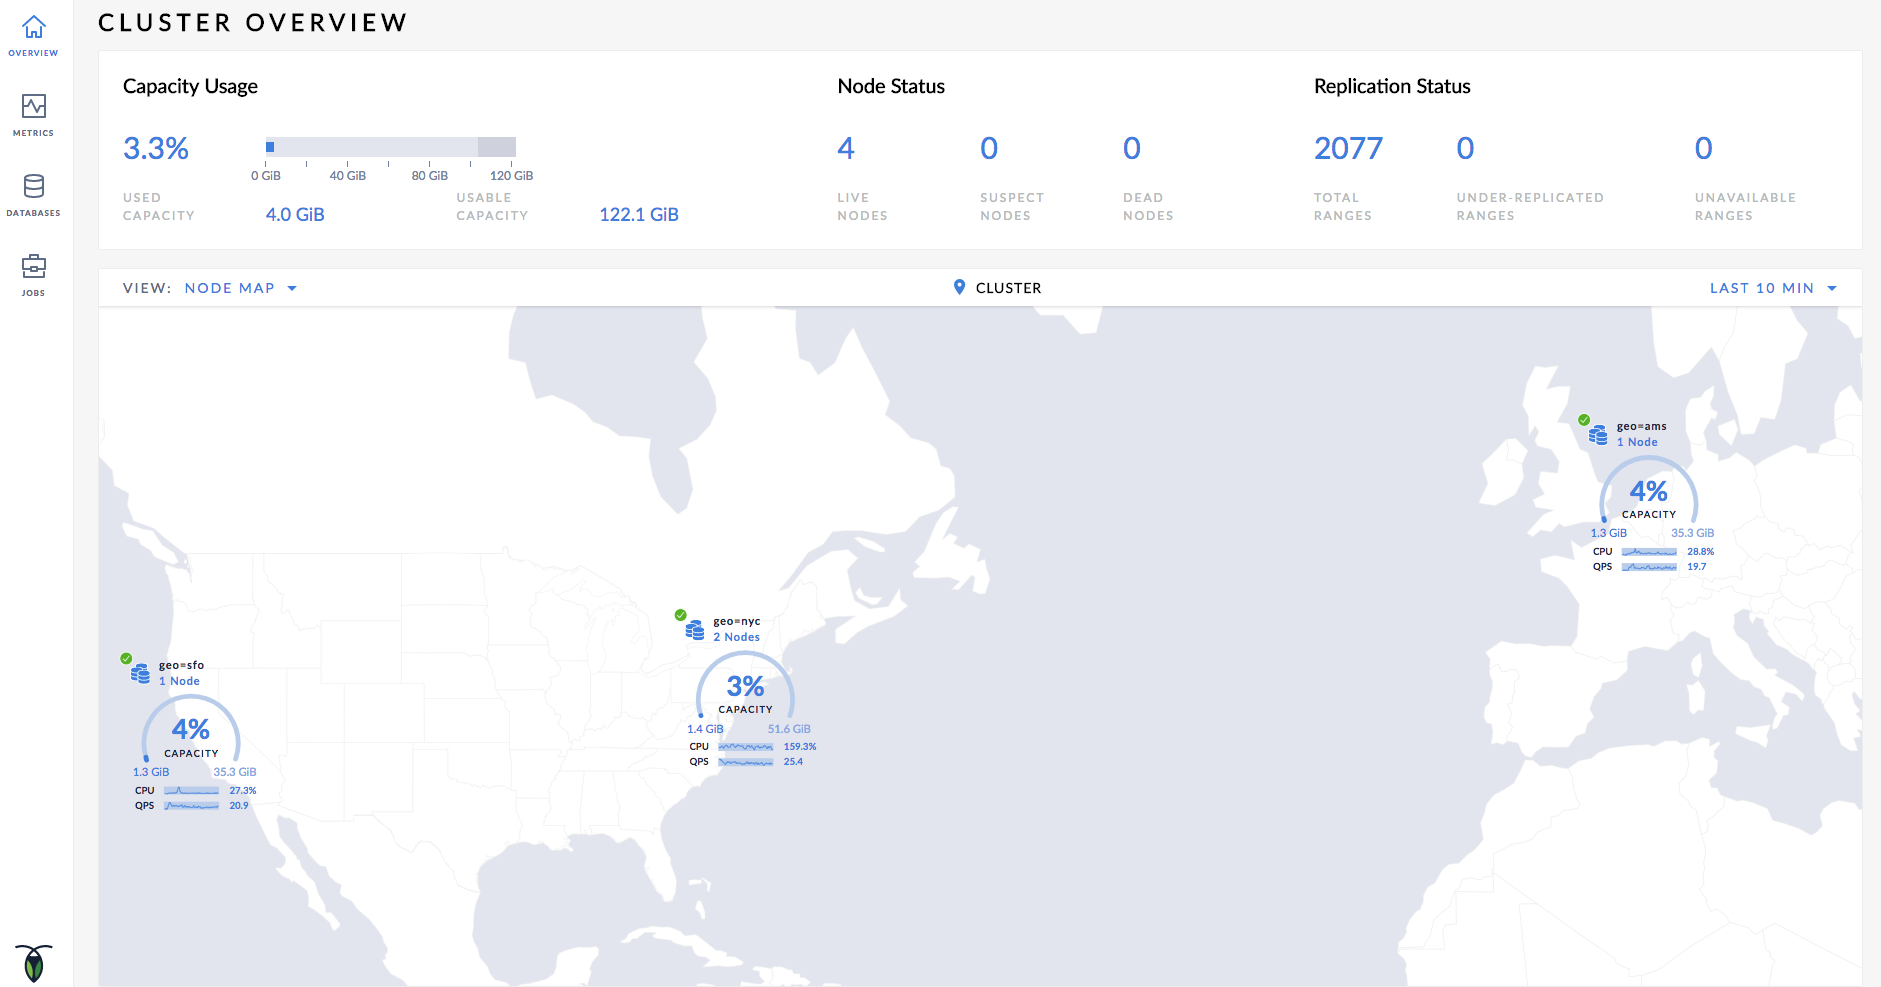
With CockroachDB, operators can view their entire cluster as a pool of resources that can smartly support distributed work loads. Maintenance operations like backups, restores, and inputs can utilize all resources available. The cluster exposes metrics that can be fed into monitoring, and applications talking to New York nodes can still access data stored on San Francisco nodes.
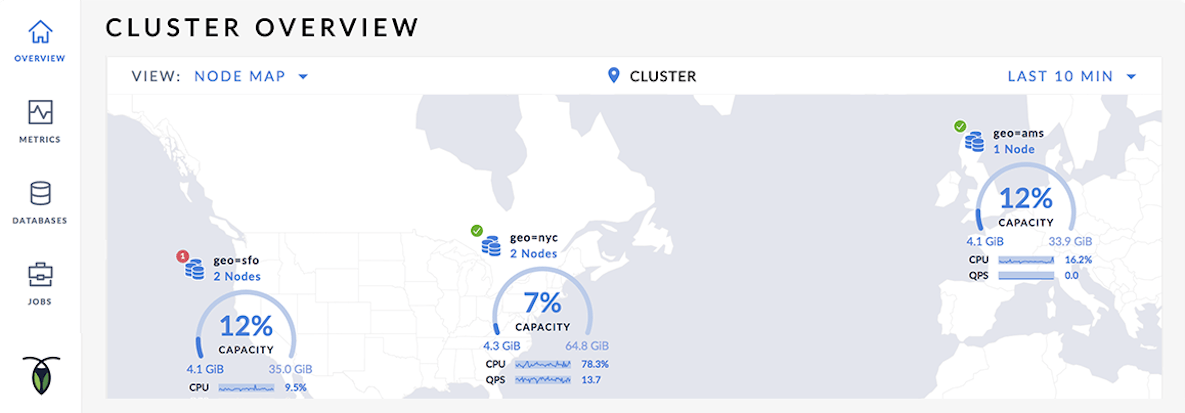
Our new cluster visualization helps developers and operators visualize this unified resource pool, offering a global view of the cluster while bucketing resources into geographic regions.
Aligning resources to customer hubs for better performance and latency characteristics
With a view of the global state of their cluster, MovR is also able to dive in deeper to view the state of just New York nodes, as shown below. These views help operators identify areas in which they may need to dig in further to troubleshoot issues.
For example, in the below view, Node 1 rejoined the cluster a couple hours ago and it appears to have more CPU and disk utilization than Node 2, which has been up for the last 13 days. This could indicate a hot range on Node 1 that ought to be split in order to more evenly distribute the load across the nodes.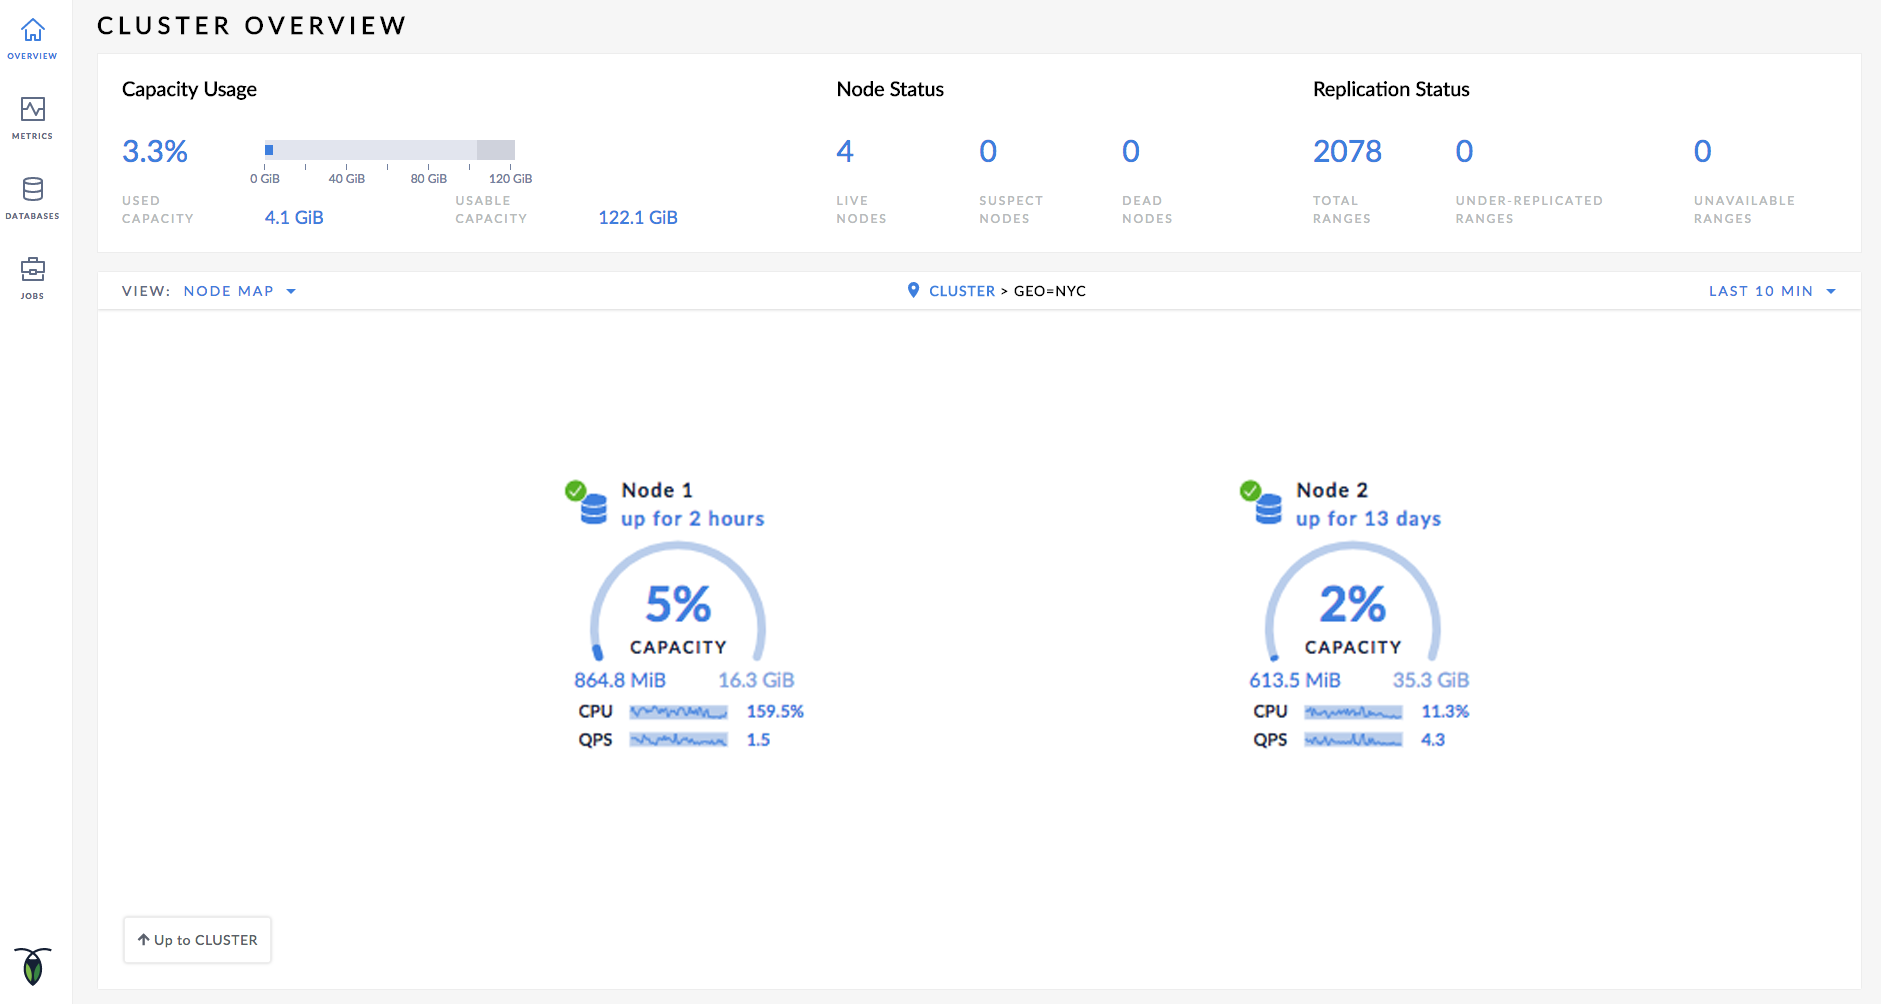
Scaling up to grow with your business
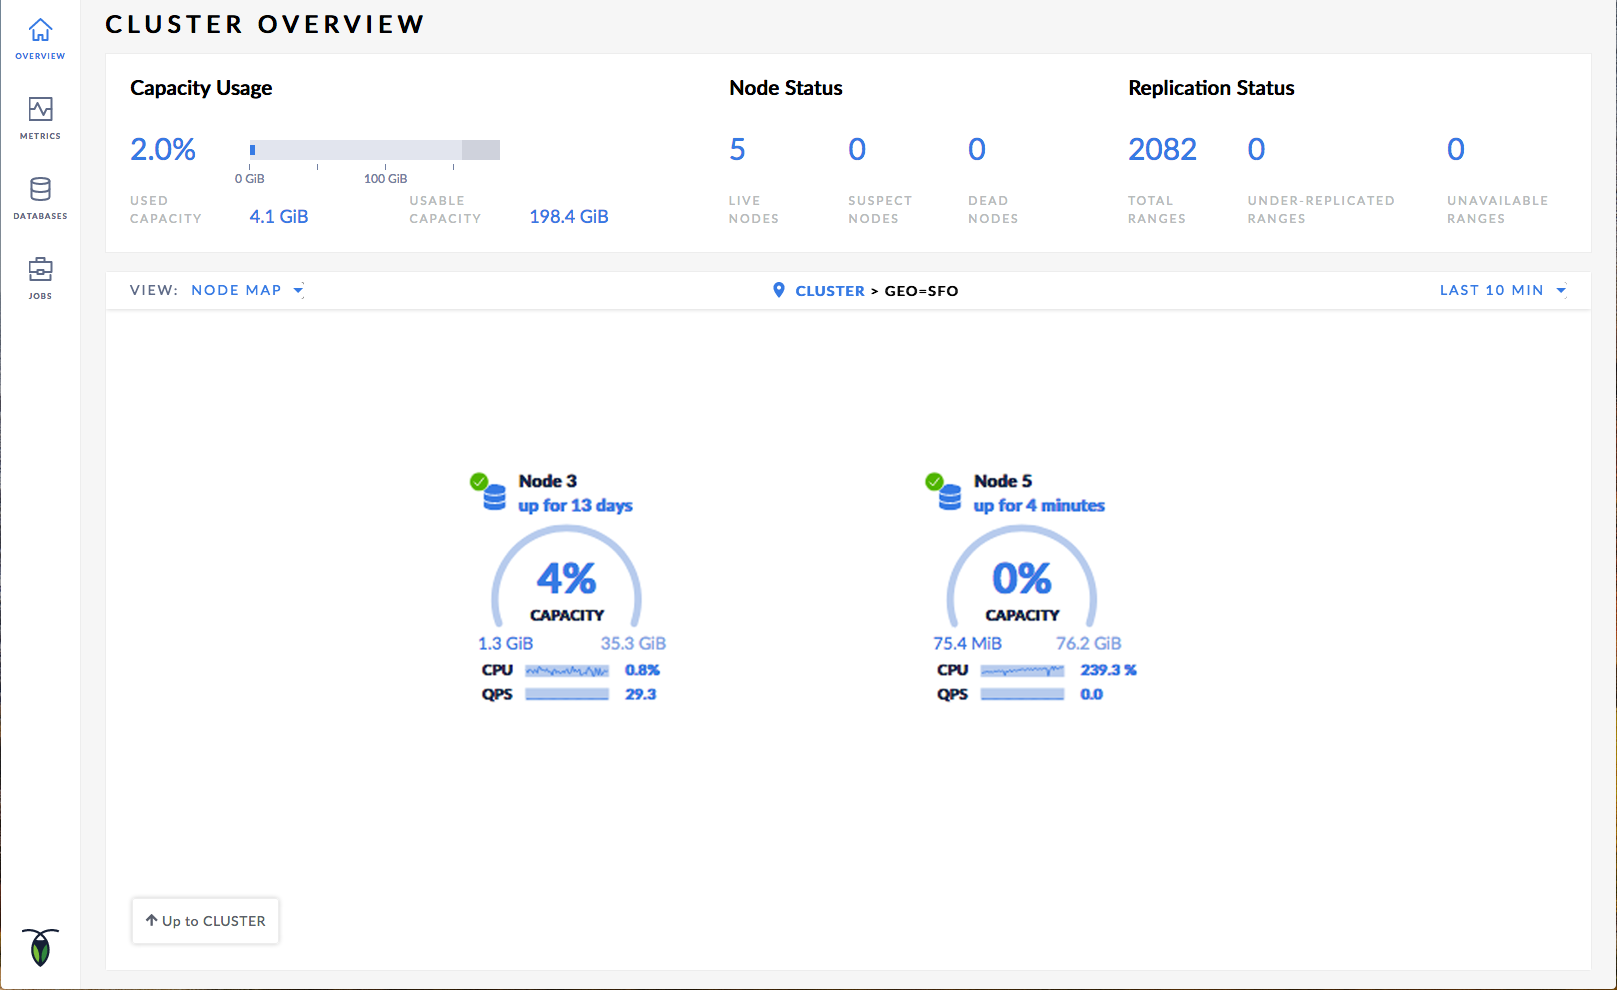
The distributed and scalable nature of CockroachDB allows companies to allocate resources to regions that need it the most. If MovR were to notice a huge spike in usage in San Francisco, they would want to add an additional node to San Francisco. They can do this quite simply by bringing up another node and having it join the cluster. Now, we can click into the San Francisco and view the two nodes that make up that region’s resources.
This is just the beginning
CockroachDB 2.0 is a peek into a new way of deploying global infrastructure. We are planning on investing more time making it easier and faster to run global databases, and invite you to join us in our journey. Currently, both the cluster visualization is an enterprise feature, but you can easily sign up for a free 30 day trial to check it out. We have startup pricing for businesses just getting started, and you can always upgrade to an enterprise license from the core (free) version.
We would love to get your feedback - please engage with us through GitHub or StackOverflow. We’d like to thank our entire community who have followed us so far, and hope to bring CockroachDB to many more users in the future.